


Virginia Tech undergraduates tackle real-world problems in a single weekend during annual data competition
With data competitions proving to be invaluable experiential learning opportunities for undergraduate students, Virginia Tech hosted its eighth-straight American Statistical Association (ASA) DataFest event this spring.
Virginia Tech’s event was one of more than 50 ASA DataFest competitions held in 2024, with over 100 colleges and universities across the nation (and beyond) taking part in the contests which were held over a two-month period.
The ASA DataFest, founded in 2011, is a celebration of data in which teams of undergraduates work around the clock to find and share meaning in a large, rich, and complex data set.
Each year, the American Statistical Association supplies DataFest organizers with an official data set provided by an outside source. This spring, students worked with data from CourseKata, a platform that creates and publishes a series of ebooks for introductory statistics and data science classes. The goal of the competition was to answer questions about how to improve the student experience of learning statistics using their interactive textbooks.
“I think of [these data competitions] as kind of a recital, like musicians do sometimes,” said Christian Lucero, collegiate assistant statistics professor and organizer of the ASA DataFest at Virginia Tech. “We’ve practiced programming and analyzing data and things like that – so now here you go and practice your craft in an open setting and just see where you are.”
Nearly 80 Virginia Tech students completed this year’s data competition, which was open to undergraduates in any major. Participants were given a weekend (April 5-7) to work on their projects, with video presentations due on Sunday.
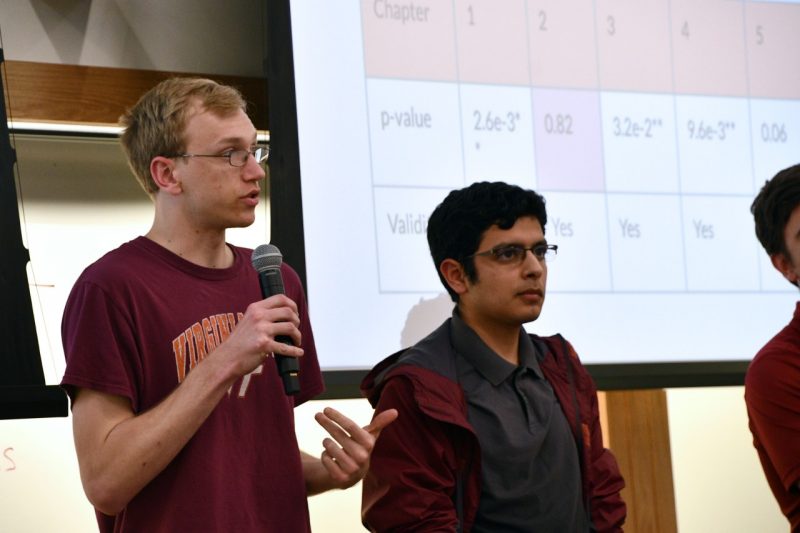
The top five teams, based on initial scoring by the event judges, then provided live presentations on Monday, April 8, to determine the final award winners.
Four prizes were awarded at the conclusion of the event: Best Visualizations, Best Methodology, Best Overall Presentation, and for the first time, a Student Peer Award, voted on by student participants.
- Best Visualizations: Furious Five – Grace Reback, Divya Polavarapu, Abdullah Rizwan, Darren Zheng, Henry Ham
- Best Methodology: Data Junkies – Surya Veluguri, Ishana Garuda, Gabriel Dell
- Best Overall Presentation (Grand Champion) and Student Peer Award: Bitwits – Alex Jaimes Sandoval, Sam Ridderhoff, Joe Harrison, Emma Tripoli, Hyesoo Kwon


