Computer science and statistics team awarded $1 million to make Big Data more user-friendly

Big Data: Everyone wants to use it; but few can. A team of researchers at Virginia Tech is trying to change that.
In an effort to make Big Data analytics usable and accessible to nonspecialist, professional, and student users, the team is fusing human-computer interaction research with complex statistical methods to create something that is both scalable and interactive.
“Gaining big insight from big data requires big analytics, which poses big usability problems,” said Chris North, a professor of computer science and associate director of the Institute for Critical Technology and Applied Science’s Discovery Analytics Center.
With a $1 million from the National Science Foundation, North and his team are working to make vast amounts of data usable by changing the way people see it.
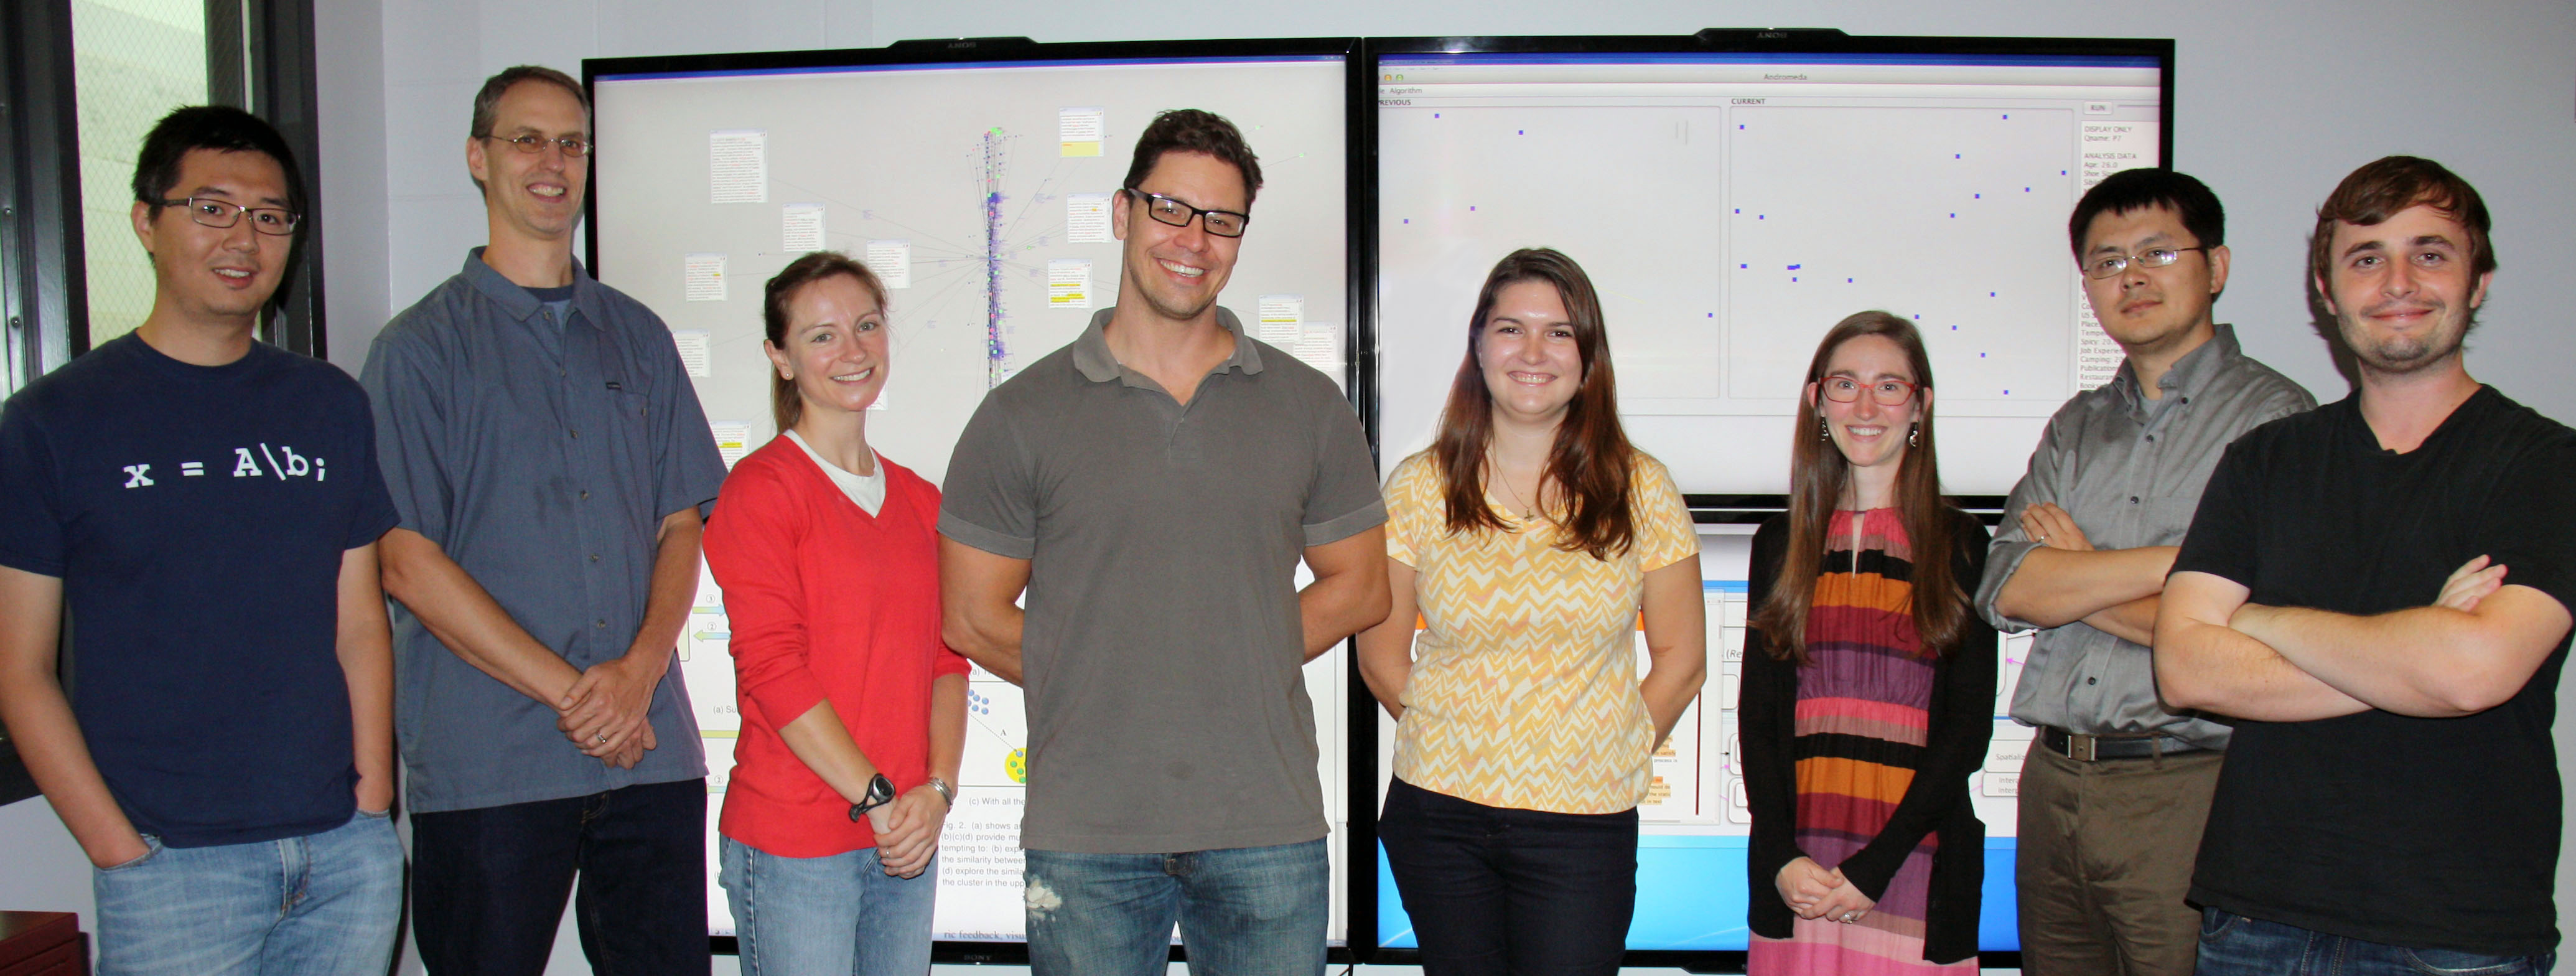
Yong Cao, an assistant professor with the Department of Computer Science in the College of Engineering, along with Leanna House, an assistant professor, and Scotland Leman, an associate professor, both with the Department of Statistics of the College of Science, are working with North to bring large data clouds down to manageable working sets.
“The platform, known as Andromeda, relies on a spatial metaphor that places similar objects (text documents, multidimensional data vectors, etc.) in closer proximity,” Leman said.
When people reorganize some objects in the space, the system is able to learn which data features express relevant patterns of similarity.
For instance, in order to remember your wallet, you might set it down next to your keys. Andromeda would be able to recognize this pattern and put your phone next to these items on the table so you won’t forget it, either.
“What makes this system unique is that users do not need to have a preformed hypothesis in order to interact with the data. In this model, the tasks of organization and discovery can occur simultaneously,” North said.
The user gains insights by observing the updated structure of the visualization, as well as learning which features are most responsible for their injected feedback.
The interdisciplinary team, which has been working together for nearly seven years since its initial grant award to study Bayesian visual analytics, has had to learn to speak two languages — that of the computer scientist and that of the statistician.
In doing so, they said they crafted a system that can essentially hide all of the cryptic “knobs and controls” and instead show the users a meaningful picture that they can manipulate.
“We will enable people to interact with the data in order to identify novel ‘what if?’ questions. People can apply their knowledge about the subject area and recognize interesting, new patterns when they arise. The visualization is then tailored to how a person thinks about the data,” North said.
And the best part is, you don’t need a Ph.D to use it.
The Discovery Analytics Center operates in Blacksburg and at the Virginia Tech Research Center - Arlington.


